
Consumers using a spot price tariff have an incentive for shifting their electricity consumption to hours with lower prices, either by automation (such as price-aware EV chargers) or manually. Consumers in Sweden (and other countries in northern Europe) have access to price data from Nordpool. This data is available for the current day, and the next day prices are set around midday of the day before. This means that there is possibility of both adapting within the day and between days. Consumers can access this data from Nordpool website or from most utilities phone applications.
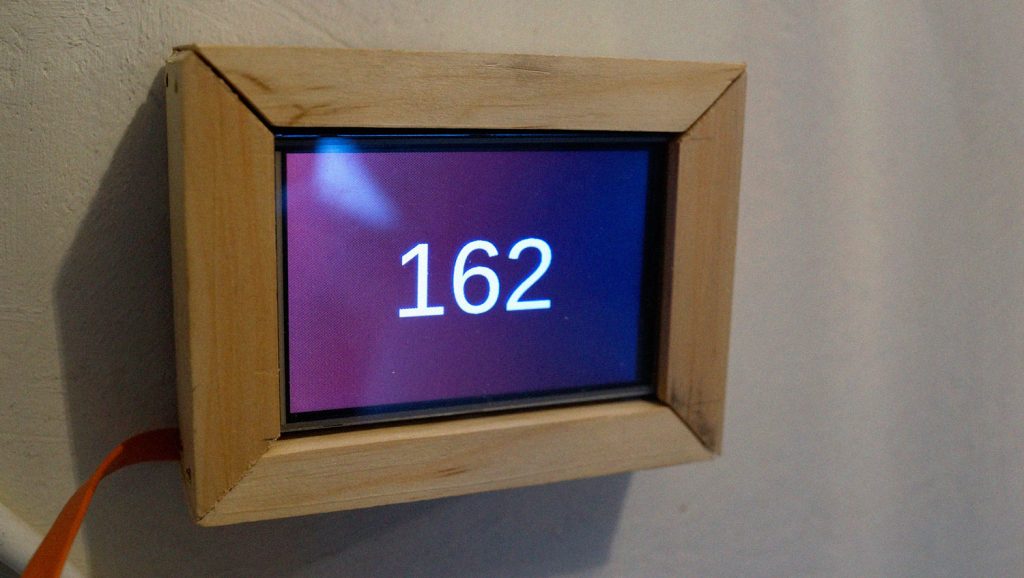
To increase the visibility of spot price data we have created a prototype of an always-on display showing the current and future prices. The prototype is built to sit in the kitchen as a place where many energy decisions take place: a) Other than heating and EV charging, the kitchen is where most energy is used in a household, and b) The kitchen is usually a central meeting point for households which is used as regular times and where other decisions can be discussed (this, of course, depends on different household setups and practices).
Prototype

The main screen shows the current spot price. The background color shifts depending on price, from blue (cheapest) – orange – red – black (most expensive).


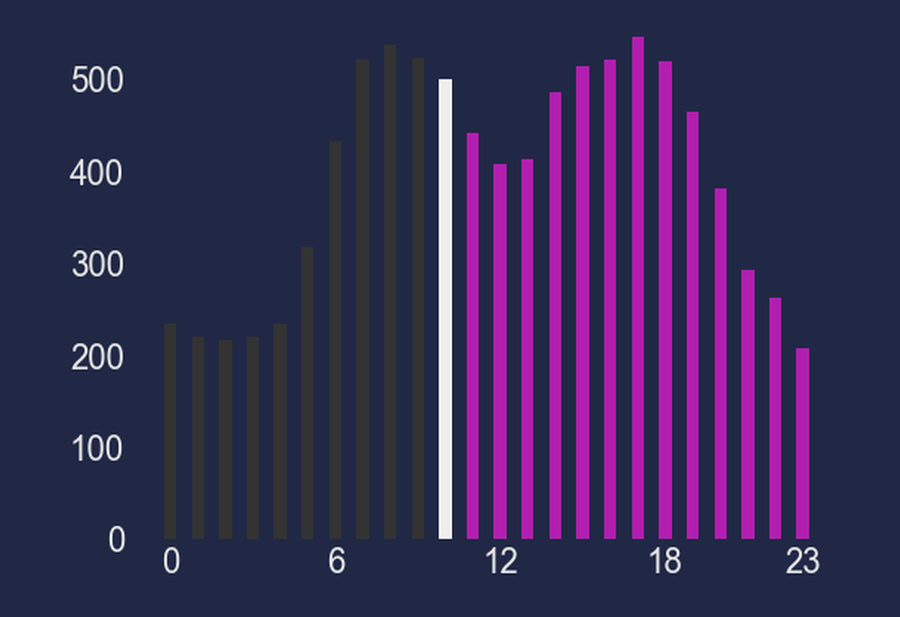
Pressing the touchscreen switchs between the current price and a graph showing the upcoming prices hour by hour for the current day and also for the next day when data becomes available.
The visualization updates every hour, while data is updated two times per day, once at midnight to new day and at midday to update with data for the next date.
Hardware: The prototype is built using a Raspberry Pi Zero W V1 and a 3.5″ TFT touchscreen from Adafruit, it also needs a SD card and micro usb charger. Approximate cost is around 1000 Swedish kr / 100 EUR. The code works on other Raspberry Pi models as long as they have WiFi, but the Zero V1 is the most economic one.
Software: The RPi is using Raspbian Buster. The visualization is programmed in Python, using Guizero and Matplotlib. The visualization is started automatically on boot up using cron and wait paragraphs.
Casing: For providing a design that melts better in the kitchen, the prototype has a case made out of alder (sustainable harvested from own forest).
Power consumption: With a Raspberry Pi Zero W v1 the prototype uses around 1.3W measured with a USB power meter. Final consumption would be a bit higher due to USB charger losses.
Adaptation strategies
Living with the spot prototype under development has already show some possibilities and limitations, even if this data is limited and anecdotical. The test and development has been at a time with specially high and volatile prices in Sweden, which also increased the incitament of adapting to prices. Some of the things that the researcher household adapted was :
- Dishwasher: programming the dishwasher at night during low cost times. This adaptation was easy to implement but there are concerns about water leakage risks when running a dishwasher unmonitored.
- Washing machine: programming washing machine at night or during days with low cost. Same as with dishwasher.
- Oven: shifting high energy cooking (such as bread baking) from days with extremely high costs to days with lower costs; using wood stove during the peak days. Shifting cooking was difficult and with a high price boundary.
- Heat system: decreasing temperature, either automatically (using spot price adaptation of heat pump) or manually.
- Warm water: no shower during high cost days. Timing is difficult due to delay of power consumption of
- Charging EV: charging EV at night or during low-costs days. Easy to implement and high impact.
Field test with different households are needed to explore these possibilities and different practices in different households with different contexts.
Discussion
- Data: The price data for spot tariff is available in Sweden and other countries from northern Europe from Nordpool. This data is visible from their website, but a subscription with high cost is needed for using their API. A solution is that many power utilities provide this data through APIs to their customers, for instance Tibber, but this would make the solution not universal nor plug&play. If hour tariffs are to be implemented more widely, which may be necessary as power production variability increases, this data should be free to access so solutions and new products can be developed.
- Prices: The price is shown in öre, which is the established unit for electricity pricing in Sweden (100 öre = 1 Swedish kr ≈ 10 EUR cents). The price is only the current price of electricity, without taxes, VAT, transmission costs, and other utility costs. Some of these extra costs such as VAT are standard and calculated as a percentage, other such as energy taxes are standard mark-up on each kwh, others such as transmission costs and utility costs depend on each user utility contract and cannot be generalised for such a prototype. The chosen solution of only showing the electricity price without taxes work is based on that the main objective is to show the relative price at the moment (higher or lower) not the absolute price, and these numbers work to show that. The numbers do not on the other side provide information on the total cost. No unit is shown beside the numbers as a way of understating this. Other solutions to provide real cost estimations could be tested.
- Relative vs absolute values: Another interesting design decision is setting the boundaries between different price steps. We decided to implement absolut boundaries. Blue 1-60 Orange Red Black 400-infinity. Many times a relative boundary setting is used, for instance based on the day or month average. The problem with that solution is that while a price of say 200 may be less than average for a day it doesn’t mean that is cheap, or a price of 30 a day with cheap electricity is still not expensive. Absolute boundaries have on the other hand problems when dealing with dramatic changes in electricity prices, what it was expensive now may become cheap in the future.
- Solar power: A future development in the pipeline is measuring home solar power production and when there is overproduction (solar system producing more than household i using and selling to the grid instead) the visualization becomes yellow to show that solar power is available. The cost of using extra solar power is zero for the user and more energy can be used (there is of course an opportunity cost of not selling the electricity).
- User tests: Next step for this prototype would be the deployment and testing in different households for understanding how users do adapt to hour tariffs and exploring ways for supporting them beyond the presentation of the cost.